Reports
BookingPress Reports allows you to analyze appointments, revenue, and customer activity in one place. These reports give you a visual understanding of how your booking business is performing over time.

Types of Reports Available
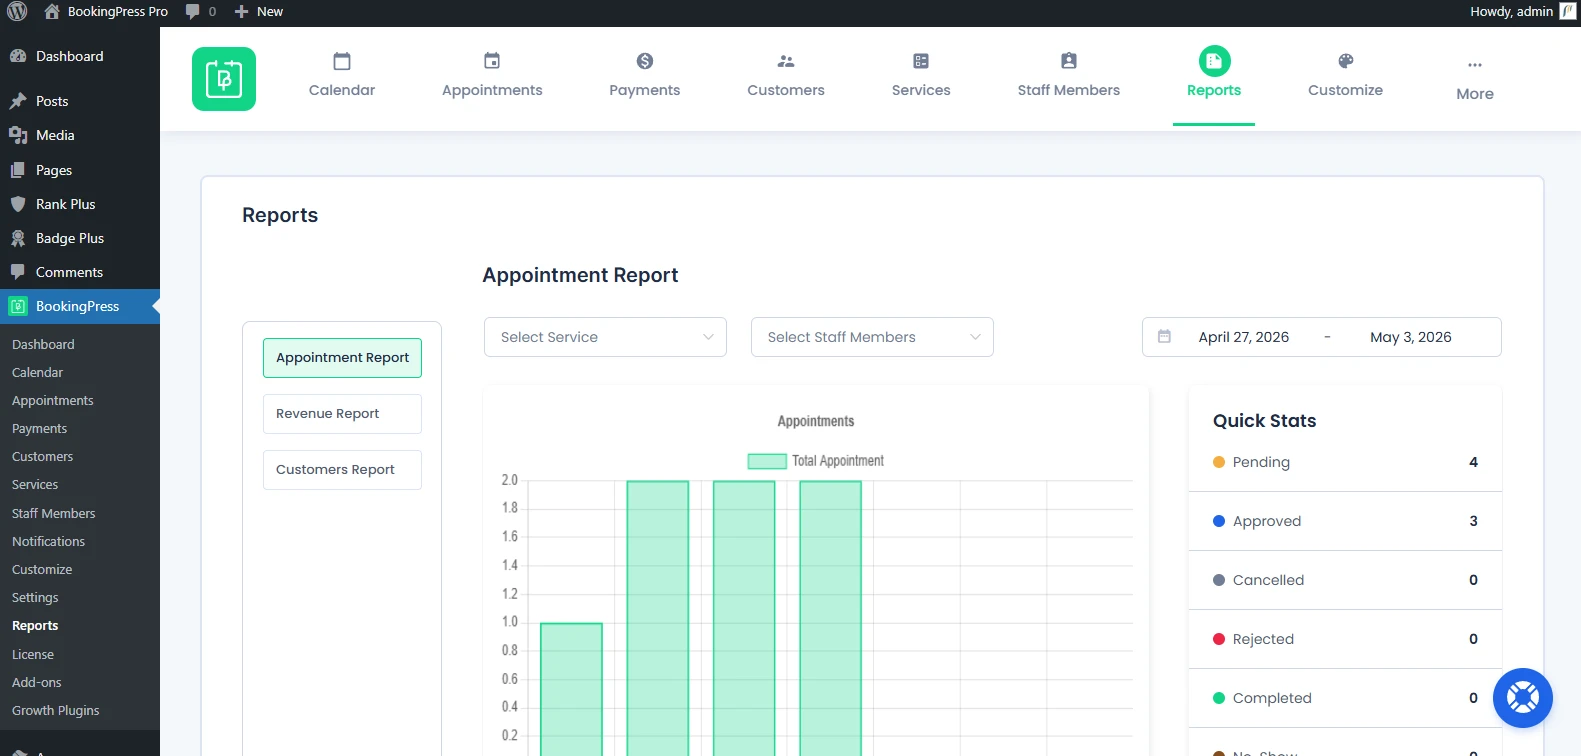
Head over to the BookingPress → Reports, and you’ll see three types of reports available in BookingPress Reports page:
- Appointments Report: Track booking activity and status
- Revenue Report: Monitor earnings and payment trends
- Customers Report: Understand customer growth and engagement
Each report includes visual charts, filters and in-depth summaries to help you make better decisions for your service business.
Let’s explore each of the report panels.
Appointments Report
The Appointments Report lets you keep a track of all booking trends, statuses and overall appointment activity.
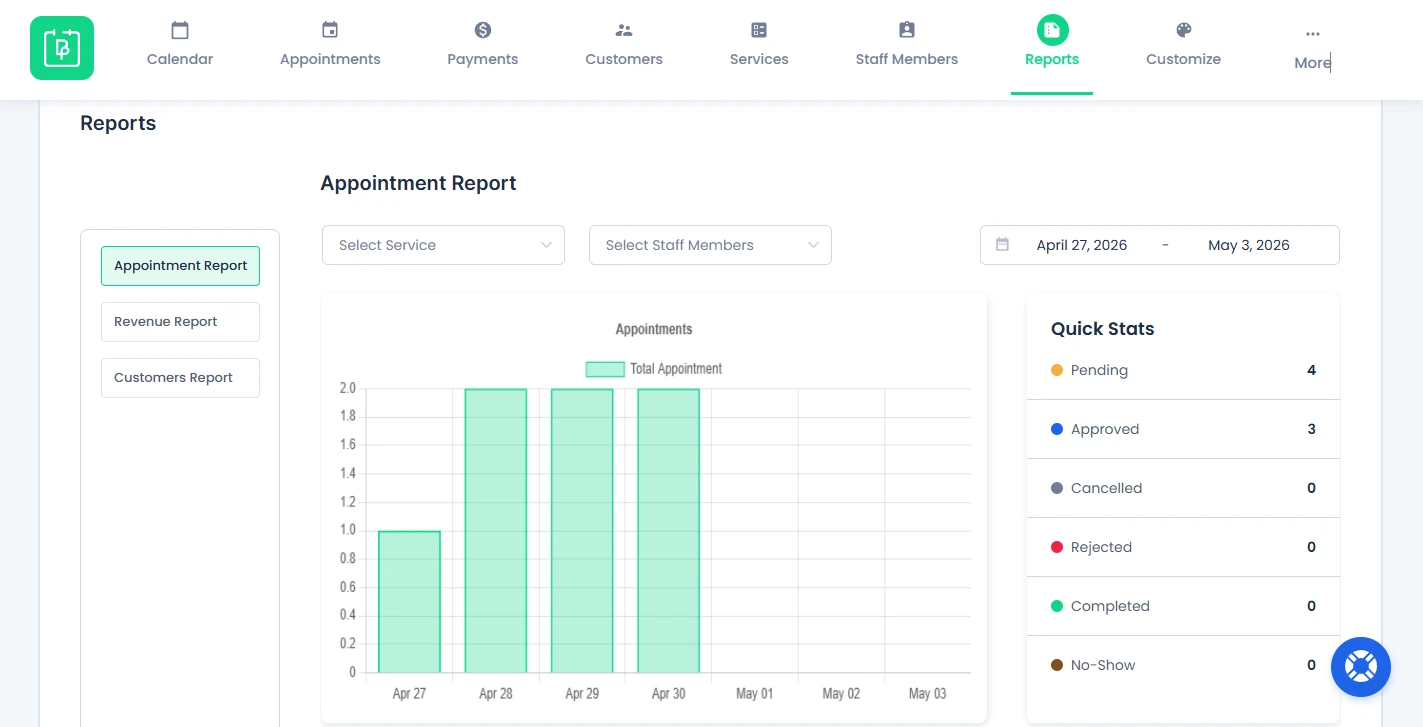
Report Visualization
First of all, you can see your all appointments shown in a bar chart, in the center of the Appointment Report Panel. This makes it so much easier to understand booking volume over time.
Filters Available
You can change and see bar chart report using:
- Service filter (select a specific service)
- Staff Member filter (Select the specific staff member)
- Date range filter (view data between specific dates)
Quick Stats
The Quick Stats section gives you a snapshot of appointment statuses:
- Pending
- Approved
- Canceled
- Rejected
- Completed
- No-Show
With this, you can quickly understand booking outcomes.
Appointment Summary
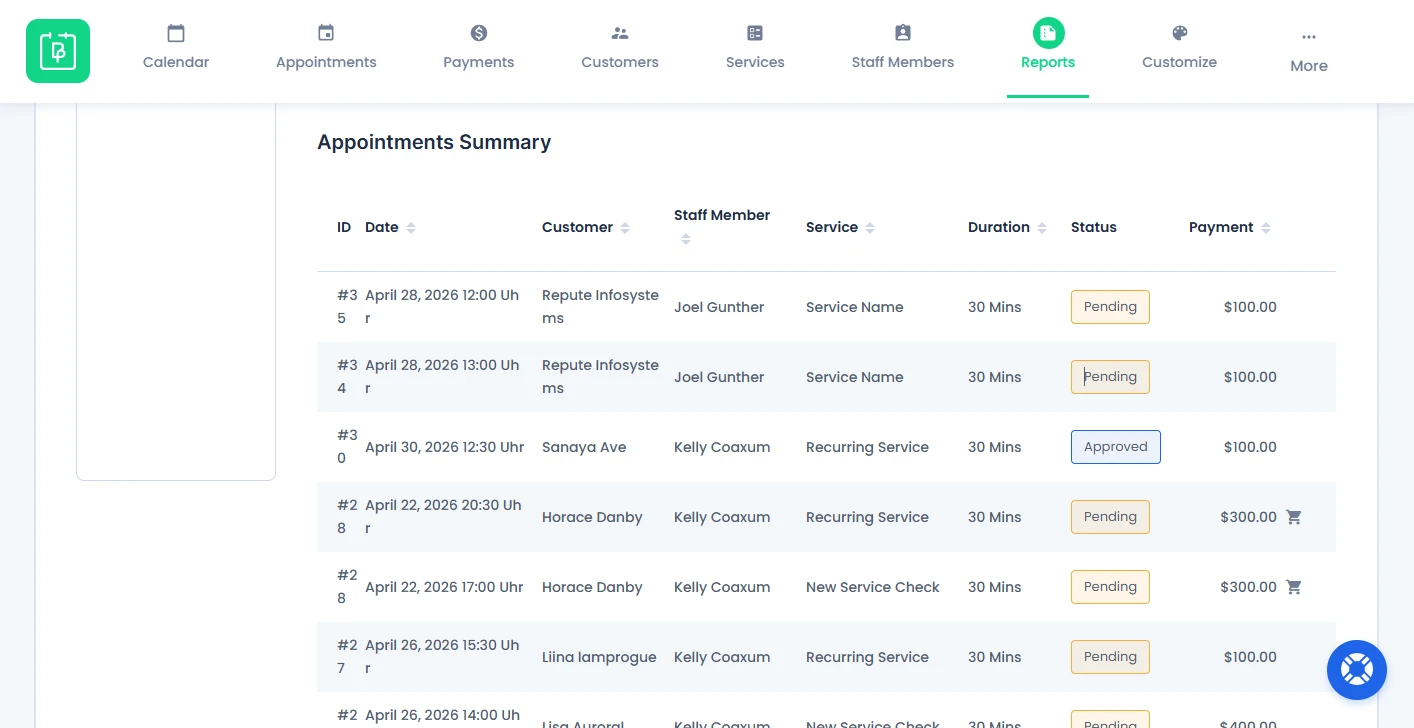
If you scroll down, you’ll be able to see a detailed table with:
- Booking ID
- Appointment Date
- Customer Name
- Staff Member
- Service
- Duration
- Status
- Payment Amount
You can also control how many records are displayed by adjusting General Settings → Default items per page
Important Note: You cannot edit appointments directly from the Reports section. This view of the Appointment Report is for analysis only.
Revenue Report
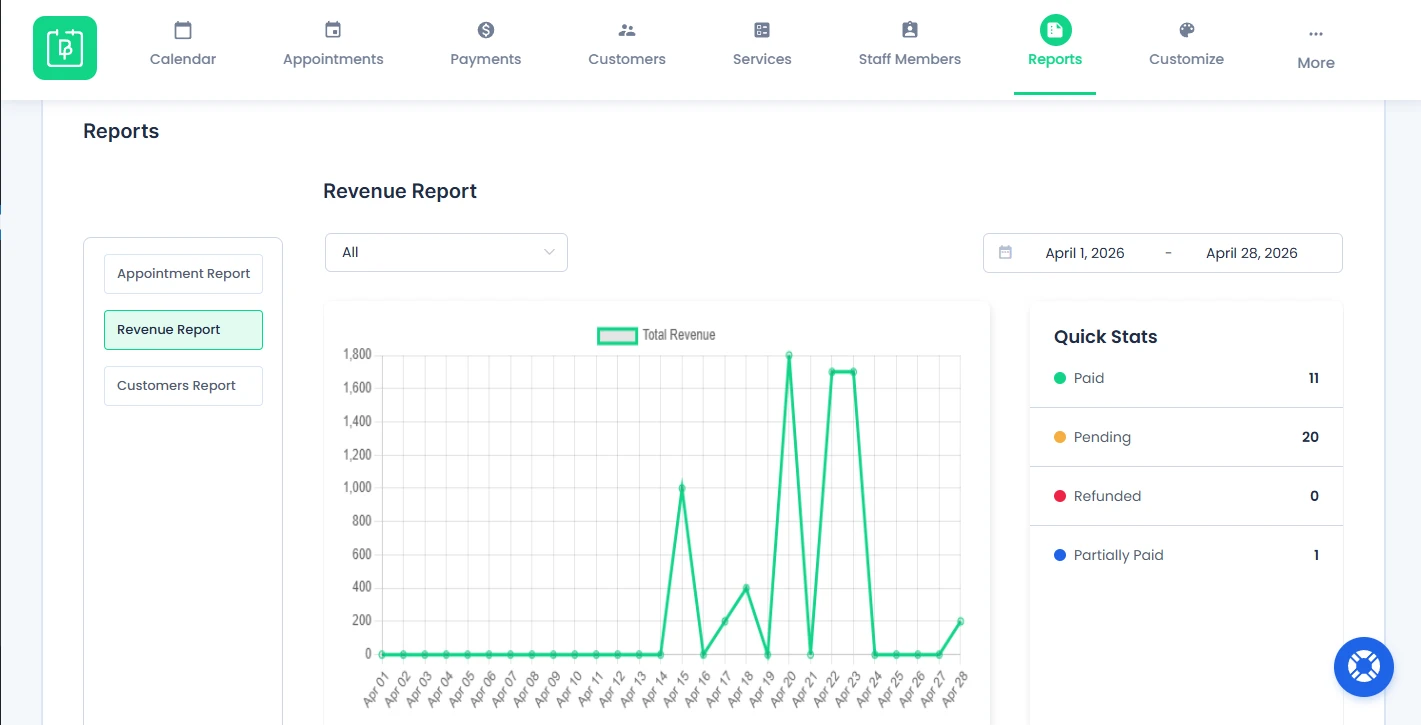
Next is the Revenue Report. From here, you can monitor income, payment status and financial performance.
Report Visualization
Revenue data is shown using a line chart. It lets you see all the earnings trends over time, helping you make better business decisions and keep your revenue consistent.
Filters Available
You can filter revenue data by:
- Payment Method
- Manual (Booked by admin)
- Onsite.
- PayPal.
- Stripe, and other configured gateways.
- Date Range
This allows you to analyze revenue from specific sources or time periods.
Quick Stats
The Quick Stats section includes:
- Paid
- Pending
- Refunded
- Partially Paid
From here, you can see the total number of all paid appointments, pending, refunded and partially paid.
Revenue Summary
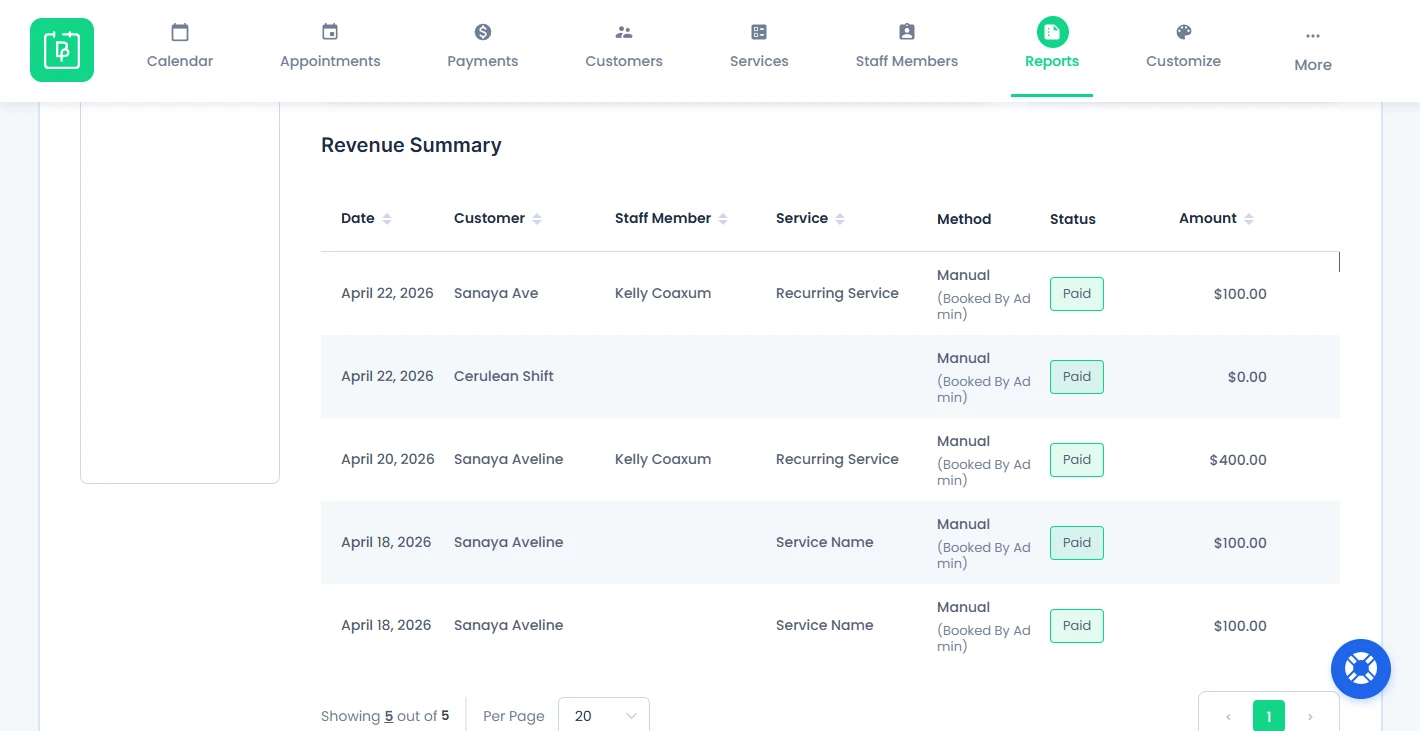
The Revenue Report also gives you a detailed summary if you scroll down. Here you can see:
- Payment Date
- Customer Name
- Staff Member
- Service
- Payment Method
- Payment Status
- Amount
Important Note: Revenue data is read-only. You cannot change payment status from this section.
Customers Reports
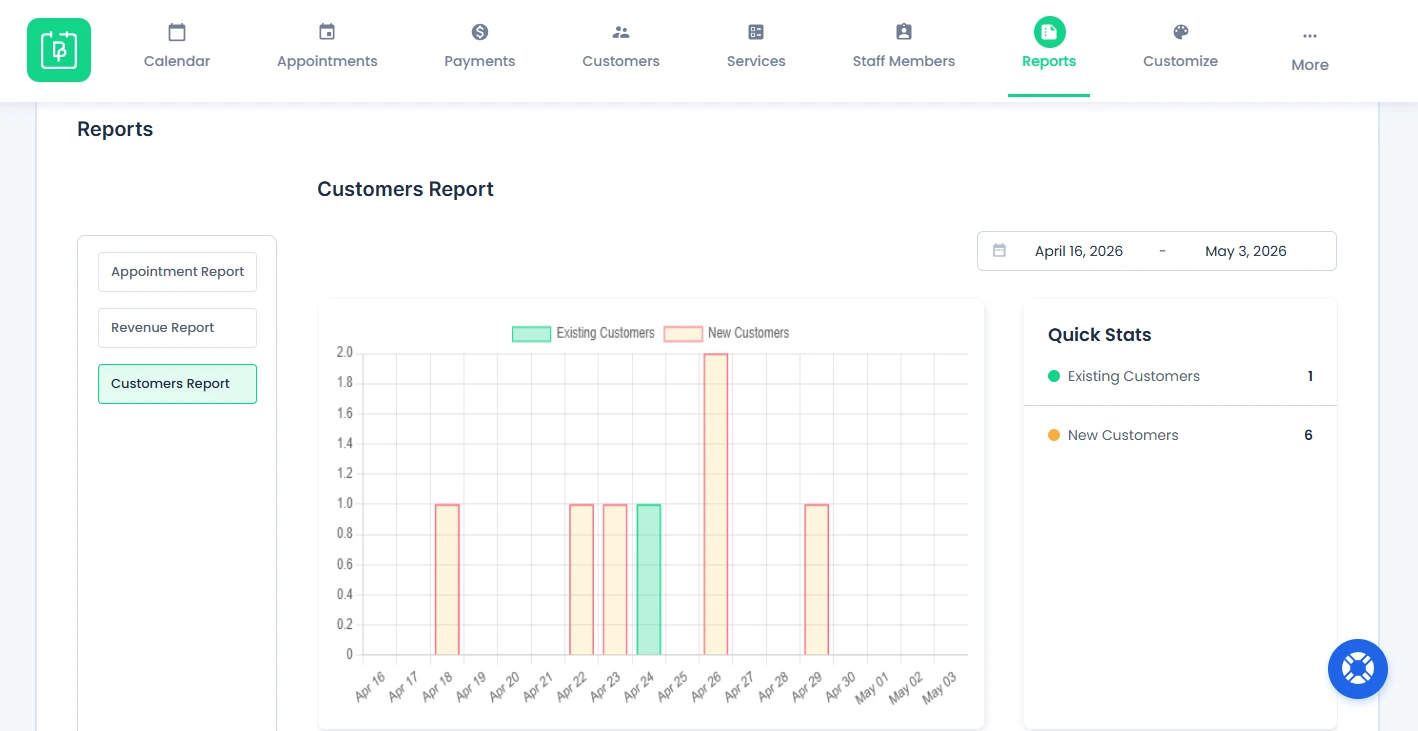
If you want to understand your customer growth, retention and booking behavior, jump straight to Customers Report.
Report Visualization
Existing and new customers data is shown in a bar graph. This makes it so much easier to track trends over time.
Filters Available
You can filter customer data using Date Range only.
Quick Stats
The Quick Stats section next to the graph shows the number of:
- Existing Customers
- New Customers
This way, you can measure your customer base growth with ease.
Customer Summary
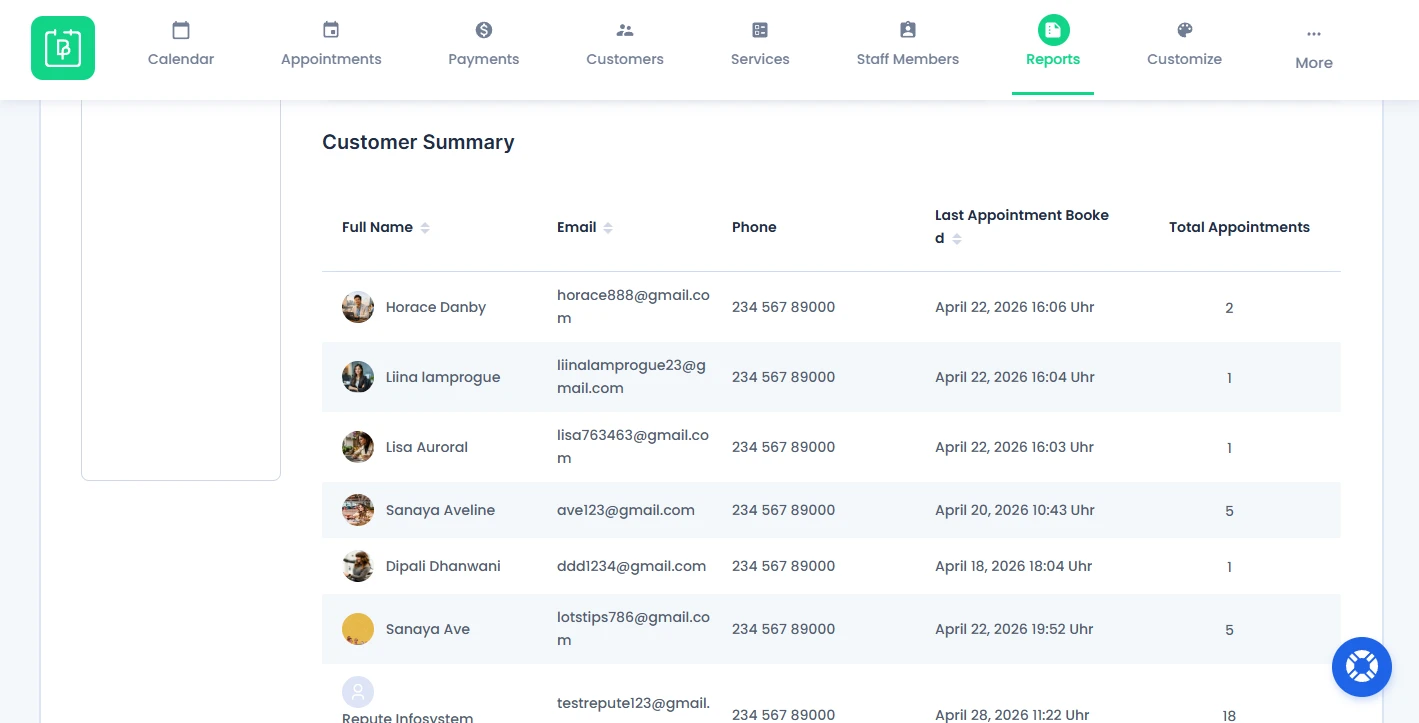
Again, if you scroll down, you can see all the customer information in detail including:
- Full Name
- Email Address
- Phone Number
- Last Appointment Booked
- Total Appointments
You can arrange this customer list in ascending or descending order by full name, last appointment booked date, and email.
Important Note: Customer data is read-only. You cannot change or edit any detail from this section.
Need a hand?
Our world-class support team is happy to help. Send us a message and we’ll take it from there.